Translate

Tuesday, April 30, 2013

Elliott wave analysis of EUR/JPY and EUR/NZD

 EUR/JPY

My preferred count is, that a wave iv triangle is building and setting the stage for one last rally higher towards 135.47 once the triangle is finished. Looking at the structure of the triangle we are currently building wave d of the triangle, which I expect will end near 130.00. Once wave d of the triangle is finished we only need one more set-back in wave e before the last rally higher. However, the triangle need to respect support at 126.43 and more importantly support at 124.87, If support at 126.43 breaks the preferred scenario tilts in favor of a top already being in place at 131.12 and wave (2) developing towards at least 118.73.

EUR/NZD

It is still an open question whether wave c of ii did finish at 1.5236 and is headed higher or we still need one last decline closer to 1.5188. As long as support at 1.5255 I will be looking for a break above 1.5356 and more importantly a break above 1.5395 to confirm that we did see a bottom at 1.5236 and is headed higher towards 1.5611. However a break below 1.5255 will indicate, that wave c is not finished yet and call for one last decline closer to 1.5188 before wave iii can take over.

Monday, April 29, 2013

Elliott wave analysis of EUR/JPY and EUR/NZD

 EUR/JPY

I'm still in the favor of the triangle scenario as long as support at 126.43 and more importantly support at 124.87 protects the downside. Ideally the c-leg of the triangle is at its terminating point and we will see a break above  minor resistance at 128.09 soon, which will confirm that the d-leg of the triangle is unfolding for a move higher towards 129.89. Only a clear break below support at 126.43 and acceleration of the price-action towards the downside will indicate, that we already have seen the top of wave 5 and (1) at 131.12 and that wave (2) is unfolding towards at least 118.73.

EUR/NZD

We could have seen the bottom of wave c of ii at 1.5236, but to confirm that we need a break above 1.5361 and more importantly a break above 1.5395, which will confirm a continuation higher towards 1.5569 and higher. At this point only a break below 1.5255 will indicate that wave c of ii still is ongoing and that we should expect more downside price-action towards 1.5188. However if we have not seen the bottom already we soon will.

Saturday, April 27, 2013

Elliott Wave analysis of DJIA, Facebook and Apple


Dow Jones Industrial Index

On April 6 I introduced the above cycle chart, that we could expect some downward pressure from the cycles until mid-April. Even though the cycles where pointing downward the DJIA kept moving higher and just as the cycles bottomed we saw a brief correction, this correction is almost erased as the cycles begin to point higher again. I'm still looking for one last rally higher to complete the D-leg of the expanding triangle, which has been developing since early 2000. Once this D-wave of the expanded triangle is finished we should be looking for a massive decline in wave E (See the chart below).

I would give a Little warning. Yes I do look for one last rally higher, but we are getting very close to a major long term top and it would be very prudent to adapt a risk adverse behavior at this point in time. If my Count is correct we should expect to see much better buying levels in the coming years ahead.

  
Facebook
 
 
We saw a nice rally on Friday and we only need a break above 27.80 and more importantly a break above 28.09 to confirm that we did indeed see the bottom of wave ii at 25.57 and that wave iii of 5 higher is developing.  My ideal target for wave 5 is at 34.10, but we should be aware, that it could terminate already at 31.45, but the structure of wave 5 as it unfolds will help us determine, where wave 5 will terminate.
 

Apple

I had a target at 391.05 and we have seen a bottom at 385.12 for now. We are still not out of the Woods yet, but all we need is a break above 437.95 to confirm the bottom and a rally back to at least 503 and possibly even higher to 594.00. However, as long as resistance at 427.55 and more importantly resistance at 437.95 hasn't been broken we could still see a deeper correction closer to 365, but it's not my preferred Count at this point.

What I find reassuring and in favor of a bottom is, that the analytics don't think much of Apple right now. They are not bearish (but then they never are...), but they are not bullish either, which is likely the best outcome for a rally in the coming weeks/months.
After the first quarter result was presented on April 24'th two Danish analyst both said, that they expected, that Apple could fall even more than the 42% it has already fallen from the top (http://investor.borsen.dk/artikel/1/256580/analytiker_intet_hastvaerk_med_apple-aktien.html?hl=QXBwbGU7QXBwbGUmcnNxdW87czthcHBsZQ,, - I know it's in Danish, but the headline says - "No rush with the Apple stock" what they mean is, that there is no rush buying at these levels, as they expect it to fall even more....  They might be right, but I having been able to buy near 391 with a stop at 385.00 a stop of only 1.6% I'm happy being long Apple.


Friday, April 26, 2013

Elliott wave analysis of Silver - It was a b-wave triangle

Silver

Just a brief follow-up on my post on silver from yesterday. It turned out that the triangle was a b-wave triangle, which called for wave c higher. One of the benefits of triangles is, that one knows that they always foresay the final move in the direction of the trend, which in this case was  a move higher in wave c and then we should see the next move lower in blue wave v and red wave iii.
So stay tuned for blue wave v down to at least 21.28 and more likely 20.35.  

Elliott wave analysis of EUR/JPY and EUR/NZD

 EUR/JPY

It is still undecided whether we are in a triangle consolidation or we have seen the final top for the entire rally from 94.10 to 131.12. The best fit to my scenario will be, that we are in a triangle consolidation and needs one final thrust towards the upside for a rally close to 135.47 to finish the entire rally from 94.10. That said, we must accept the fact that a top already could be in place, but to confirm that outcome we need a break below 126.43 and more importantly a break below 124.71, which confirms that wave (2) is developing for a decline towards at least 118.73.


EUR/NZD

We have seen a small break below support, which does open the possibility for a slightly deeper decline in wave c, of the expanded flat correction, towards 1.5188. That said a break above 1.5320 will weaken the downside momentum and a break above 1.5409 confirms that wave c is finished and wave iii higher is developing. As wave ii is an expanded flat I'm more than convinced, that wave iii will be an extended wave and at least 1.618 times wave i, but it could easily be both 2 times and 2.618 times longer than wave i. However, for now I'm looking for a bottom of wave c near 1.5188 or upon a break above 1.5320.

Thursday, April 25, 2013

Elliott wave analysis on Silver


Silver

CJ asked me about Silver and if a triangle was developing. The answer to that is yes it is a triangle. It could be a b-wave triangle calling for a little more upside action before the next decline. However, I do think it's more likely, that this is a wave iv triangle calling for the final thrust Down in blue wave v, but that does not make the next low the final low. We will see more downside action and we will also soon have the final decision on whether the major rally from 4.00 in 2001 to 49.79 in 2011 (nice 10 year rally) was just a major corrective rally or it will develop into an impulsive rally. All odds favor the corrective scenario at this point.


Elliott wave analysis of EUR/JPY and EUR/NZD

 EUR/JPY

The price-action of late has been corrective in its structure both in up and down moves, which could be consistent with a triangle developing. If a triangle is developing, we know that we will see on last thrust towards the upside followed by a correction. Even though it has been very difficult to decipher the price-action lately one last rally to above the former top at 131.12 will fit the ideal scenario best. If a triangle is developing we can expect a move towards 135.47 in wave v. The target is arrived by measuring the widest part of the triangle and add that to the possible bottom of wave e of the triangle. Wave e is still not in place, but a qualified guess is, that wave e will terminate close to support at 128.80. That said a break below 127.86 and more importantly a break below 126.43 will invalidate the triangle scenario and indicate, that wave 5 and (1) already is in place at 131.12 and wave (2) is developing.


EUR/NZD

The c-wave of the expanded flat correction has been deeper than I first anticipated, but we are currently at support at 1.5274, where wave c is 2 times longer than wave a, however to confirm that wave c is done we need a break above 1.5367. As long as minor resistance at 1.5367 protects the upside we could see wave c continue lower to 1.5188, where wave c will be 2.618 times longer than wave a, but the should be the ultimate target for wave c and from 1.5188 or upon a break above 1.5367 we should see a powerful rally in wave iii towards 1.6145 and possibly higher.

Wednesday, April 24, 2013

Elliott wave analysis on Natural Gas - What difference a year makes...

Natural Gas

If you are one of my long term readers you will likely have read my posts on Natural Gas a year ago remember? If not you can read some of my post here:

http://theelliottwavesufer.blogspot.dk/2012/04/elliott-wave-on-natural-gas_19.html and here

http://theelliottwavesufer.blogspot.dk/2012/04/important-bottom-in-place-in-natural.html

As I pointed out in my first post, we should not see a break below 1.87 and the bottom was found at 1.90 just 3 very small pips above the ultimate low.

In my second post I made a call for a rally towards 4.34, which now has been tested, which is a rally of 99%, that is a nice rally.

If my mind serves me well, not many called for a long term bottom in Natural Gas a year ago. But it has turned out to be a valid long term bottom and if my Count is on track we should expect more upside pressure for the coming months. I'm looking for a continuation higher towards at least 5.00 and more likely higher towards 6.00 before we should expect a bigger correction. 

Elliott wave analysis of EUR/JPY and EUR/NZD

 EUR/JPY

We saw a move closer to important support at 126.43 yesterday, but no real follow-through, which means the tug of war between the bulls and the bears is still ongoing. I still favor the downside slightly over the upside, but as long as support at 126.43 has not been broken we could still see a new rally above minor resistance at 129.99 and more importantly resistance at 130.67, which would call for one last rally higher towards 131.27. On the other side a break below important support at 126.43 will confirm, that the bears has won the tug of war and indicate that wave 5 and (1) ended at 131.12 and wave (2) is developing for a correction back to at least 118.73.

EUR/NZD

The failure to sustain the break above 1.5577 confirmed that an even more complex correction was developing. The correction went from a flat correction into an expanded flat correction. Short term we are looking for one last decline into the 1.5328 - 1.5338 area from where wave iii is likely to take over an develop into an extended rally. When we see an expanded flat correction we should expect the following impulsive move to extend meaning that it would be longer than the first impulsive move we saw and in this case, that was the rally from 1.5080 to 1.5577. That Means, that once wave ii is done we can calculate the most likely ending point of wave iii. The first target we expect will be where wave iii is 1.618 times longer than wave i, which would call for a rally towards 1.6145 and possibly higher, but time will show.

Tuesday, April 23, 2013

Elliott wave analysis of EUR/JPY and EUR/NZD

 EUR/JPY

The break below support at 128.78 once again increases the odds for a top being in place already at 131.12. However, we need a break below 126.43 to confirm, that the rally from 124.87 only was in three waves and therefore only a correction. This tug of war between bulls and bears will soon find its winner. If the bulls win we still need one last rally above the former high at 131.12, but the possible upside should be very limited. If the bears win we will see a break below 126.43 and likely an acceleration towards the downside as long position are closed fast. No matter if the bulls or the bears are winning this tug of war, we have a complete five wave rally of the 94.10 low to the high of 131.12. Even if we does see more last high we should be very close to the top and should prepare our self for wave (2) to take over. Wave (2) should at least take us down to the bottom of wave 4 at 118.73, but the decline in wave (2) could be deeper.

EUR/NZD

We are currently seeing a break above the channel resistance-line near 1.5577. If this break is confirmed my bullish call is confirmed and we should see acceleration as wave iii progresses for a rally towards at least 159.17 and more likely higher towards 1.6207. However as long as resistance at 1.5577 protects the upside we could risk another set-back in an even more complex correction, but the would take a break below 154.87 to confirm that this even more complex correction, than we have already seen, is taking place and a new move towards 1.5405 and maybe down to 1.5375 should be seen.

Monday, April 22, 2013

Educational - Basis tenets of the Elliott Wave Principle

With c

With courtesy of Elliott Wave International:

Potxotxo has asked "what happens once wave 5 terminates in EUR/JPY?":

The chart above shows what we can expect once wave 5 terminates and below a simple explanation.

Now observe that within the corrective pattern illustrated as wave in Figure 3, waves (a) and (c), which point downward, are composed of five waves: 1, 2, 3, 4 and 5. Similarly, wave (b), which points upward, is composed of three waves: a, b and c. This construction discloses a crucial point: that impulsive waves do not always point upward, and corrective waves do not always point downward. The mode of a wave is greatly determined not by its absolute direction but by its relative direction. Aside from four specific exceptions, which will be discussed later in this booklet, waves divide in impulsive mode (five waves) when trending in the same direction as the wave of one larger degree of which it is a part, and in corrective mode (three waves or a variation) when trending in the opposite direction. Waves (a) and (c) are impulsive, trending in the same direction as wave . Wave (b) is corrective because it corrects wave (a) and is countertrend to wave . In summary, the essential underlying tendency of the Wave Principle is that action in the same direction as the one larger trend develops in five waves, while reaction against the one larger trend develops in three waves, at all degrees of trend.


As a quick guide to the Elliott Wave Principle you should read this description of the basic tenets from Elliott Wave International here: http://www.elliottwave.net/educational/basictenets/basicsforeword.htm

However I would recommend, that you read Frost's and Prechter's "Key To Market Behavoir". You can read it for free here: http://www.elliottwave.com/club/elliott-wave-principle/default.aspx?code=47567

I would also like to recommend Ramki's "Five Waves To Financial Freedom". You can only get the book from Amazon.com: http://www.amazon.com/Five-Waves-Financial-Freedom-ebook/dp/B005JC5WWU
I think it's one of the absolutely best books on the Elliott Wave Principle that you will ever read and to the price of USD 14.99 I doesn't come much cheaper than that.


Elliott wave analysis of EUR/JPY and EUR/NZD

EUR/JPY

We have seen a slow continuation higher and with the break above 129.73 we should see a new high above the former top at 131.12. That said, I do not expect that this possible new top we cover much new ground and  could well stall already at 131.28. Short term I expect a minor set-back towards 129.48 before the last rally higher to the ideal target at 131.28. However, we are fast closing in on the top of the entire rally from 94.10 and I will continue to look for signs that this rally is over and a big correction in wave 2 sets in either from 131.28 or upon a break below 128.78.

EUR/NZD

With the failure to break above 1.5577 it is still an open question whether we have seen the bottom of wave ii at 1.5408 or not. I still think that the odds slightly favor the bottom-scenario, but I will wait patiently for the confirmation, which a break above 1.5546 and more importantly a break above 1.5577 will be. Once resistance at 1.5577 is cleared we should see a powerful rally towards at least 1.5683 and likely even higher towards 1.5818. Short term I'm looking for one last small decline to 1.5439 and maybe even 1.5426 before the next real upside pressure kicks in, but it will take a break above 1.5546 to indicate that wave ii is over and wave iii is developing.

Friday, April 19, 2013

Elliott wave analysis of DJI, Facebook and Apple - Major S/H/S top in Copper?


 Copper

Massive Shoulder/Head/Shoulder top might have been activated, with a target near 2.0. Short term I would like to see a break below 2.99 and even better a break below 2.72 as that would confirm the decline to the S/H/S target at 2.0.

If we does see a decline to 2.0 in copper, that will mean that the global economy is slowing down and it will put pressure on stocks and likely lift bonds (lower interest rates) again.

Dow Jones Industrial Index

Time for a correction in wave iv before the last and final rally higher? We are getting close to an important top both short term and long term. Before we begin to call gloom and doom over the stock markets I think we need one more lift higher, but it will be very prudent to move the protective stop in close at this point I would call a top, if we does see a break below 13.784

Facebook
 
We have seen a very deep wave ii of 5, but we have likely seen the bottom or is very close to see the bottom in wave ii just slightly below 25.16, but no break below 24.73 is allowed. That should present a very low risk trade buying with a stop at 24.70. However, at this point we would love to see a break above 27.80 and more importantly a break above 28.09 as that would confirm the next powerful rally higher towards at least 31.45. As a target for wave 5 I'm looking for a move to 34.10.
 
Apple

Hit my target at 391 yesterday and we could well have seen the bottom of the correction from 703.86.
I would expect a rally to at least 594.25 to develop soon, if it hasn't already begun. That should be a nice rally of at least 51% from here. That said we now need some prof, that a bottom might be in place and the first indication will be a rally above 405 and more importantly a break above 427 that would call for the rally towards 594.25.

Elliott wave analysis of EUR/JPY and EUR/NZD

 EUR/JPY

We are grinding slowly higher, but the rise from 126.43 is nowhere close to have impulsive characteristics. At this point only a break above 129.73 will release some more bullish upside pressure for one last rally to just above 131.12 before wave 5 finally find its top. On the other hand a break below 127.58 will have given us another lower high and the risk of wave 5 already being in place at 131.12 increases dramatically. That said it will take a break below 126.43 to confirm this lower high and a continuation down towards 124.87.

EUR/NZD

If we did see wave c of the expanding flat correction ending at 1.5308 yesterday, then wave v of c ended with a failure (no new low below wave iii of c was seen), this is normally a sign of strength of the underlying trend, which in this case is up. If we did see wave ii end at 1.5308 we should  ideally we will see support at 1.5464 protect the downside for a very powerful rally above 1.5577 soon and higher towards 1.5683 and 1.5818. A break below 1.5464 and more importantly a break below 1.5427 will indicate, that the correction in wave ii is ongoing and that we should expect a decline towards the 1.5355 - 1.5376 area before wave ii is over and wave iii higher takes over.

Thursday, April 18, 2013

GDX is closeing in on its S/H/S target, but we are not there yet...

GDX - Gold Miners

Willem has asked me about the Gold Miners Index GDX and if I think it has finished its move towards the downside.

I agree with Willem, that it's very oversold, but have you ever noticed, that often in very powerful moves, the better part of that move, happens under oversold conditions?

We don't have any divergence between Price and the indicators shown and the first thing I noticed looking at the chart, was the massive Shoulder/Head/Shoulder top, which has a target near 23.00. I think we will see GDX move lower before this decline is over and I would not bet on it before we are closer to the S/H/S target near 23.00.

Elliott wave analysis of EUR/JPY and EUR/NZD

 EUR/JPY

As long as support at 124.87 protects the downside I'm still looking for one last rally to a new high slightly above 131.12. However, it should be remembered, that we are in the absolute final stages of the rally, which started at 94.10 and once this rally completes I expect a big correction towards at least the 118.73 - 119.10 area. Even though I expect one more rally higher, the possible odds, that wave 5 already is in place is so high, that I'm  more focused on the downside risk. A break below 127.15 and more importantly a break below 124.87 will increase the downside pressure and indicate, that wave 5 did indeed end at 131.12.
EUR/NZD

I'm looking for one last decline in wave c of an expanded flat correction, which are developing in wave ii. Short term I expect minor resistance at 1.5483 will protect the upside for this last decline towards the 1.5361 - 1.5375 area, with a possibility of an extension towards the 1.5319, but looking at the structure I do think the risk of an early termination, of this expanding flat, is more likely. From 1.5375 or upon a break above 1.5527 I expect to see a powerful wave iii higher towards at least 1.5853, but an extension of wave iii is more likely, which would push wave iii higher towards 1.6148 and possibly even higher towards 1.6330.

Wednesday, April 17, 2013

Elliott wave analysis on Gold, Crude Oil, Facebook and Apple

 Gold

Is well under way to my target at 1,250. Currently we have seen blue wave iii Down to 1,322, where blue wave iii was 2.618 time the length of blue wave i. We should see a series of wave iv and v developing in the coming days/weeks.

 Crude Oil.

Failed to break out of its triangle towards the upside and has instead broken towards the downside, but we need a break below 84.07 to confirm a continuation Dow towards strong support at 75.62.
But only a break out of the long term sideways consolidation will really get Things going here.

Facebook

After a perfect five wave rally of the low at 24.98 we are currently in wave ii of 5. Longer term I'm looking for a rally towards the 33.44 - 34.10 area, which will terminate wave I of A. Short term I looking for wave ii of 5 to terminate in the 26.00 - 26.40 area from where the next powerful rally is expect to develop. At no point can a break below 24.98 be accepted as that would invalidate my bullish Count.

Apple

Is getting close to my ideal target at 391, from where I expect a rally towards at least 594.
Even if we manage to break below 391, the downside should be limited to the 360 - 365 area, so we are getting close to a very nice buying opportunity.

Elliott wave analysis of EUR/JPY and EUR/NZD

 EUR/JPY - Weekly

I have been studying Glenn Needly's (Neowave) time rules yesterday and I need a little more time checking different things out, so this morning you have a "brief" update only.

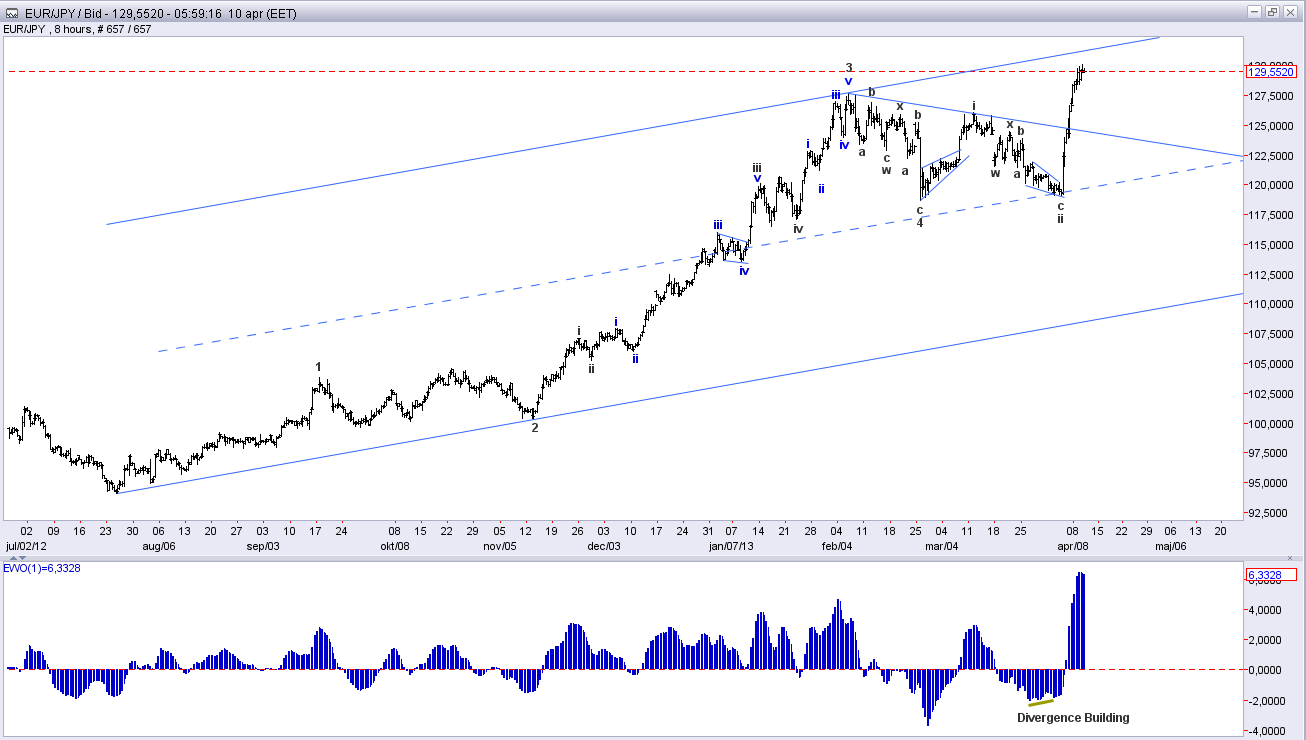
As can be seen we have a clear five wave rally from 94.10, what we are trying to establish is whether wave 5 is in place already or more upside action is to be seen.

It's clear that wave 3 was the extended wave and that often means that there will be equality between the two other impulsive wave, which in this case is wave 1 and 5. Looking at them wave 5 currently is a little longer that wave 1, but they are close enough to be as equal as one can expect.

If we measure the distance traveled from the bottom of wave 1 to the top of wave 3 we can see that wave 5 is almost 38.2% of that distance, so we have two demands fulfilled for a possible wave 5 top in place.

Nguyen yesterday point out, that wave 5 is to short time wise to fulfill Glenn Needly's time rule, which states that two waves next to each other, the smallest of the waves (time wise) should be at least 1/3 of the longer wave, which in this case means, that wave 5 should take at least 2,66 weeks and it has only taken 2 weeks till now, that means we should see more upside pressure this week, but does we need a new higher high? knowing Needly's work then the answer is no. He more than any other analyst, I know, works with termination points below a top or bottom. That is not to say that we have seen the final high at 131.12, I still think that one more new high would fit my picture better, but the break below 126.03 did confuse the overall picture and if my count is correct, the only possible impulsive move, where that is allowed is in an ending diagonal.

EUR/NZD - Weekly

Only made it to 1.5402 yesterday and has already broken above the top at 1.5558, but is wave ii finished? I don't think so. I think an expanded flat correction is building and that means that we should soon see a new downturn towards the ideal target area between 1.5263 - 1.5319. Wave ii will likely terminate closer to 1.5319 than 1.5263, but only time will tell.

Looking at the larger picture it's clear that the possible upside potential is huge and the minimum target for this rally is close to 1.6973, but I still think we will see much higher levels longer term.

Tuesday, April 16, 2013

Elliott wave analysis of EUR/JPY and EUR/NZD

 EUR/JPY

The break below my invalidation point at 126.03 we are left with two options. 1: The entire five wave rally rally since 94.10 ended with the test of 131.12 and if this is the case we are looking for a large corrective wave 2 down to at least 118.73. Looking at the decline from 131.12 is does have impulsive characteristics, which would be what we are looking for in a simple zig-zag correction. The second option is that some kind of ending diagonal is developing calling for one more high above 131.12. I do not favor this options, as ending diagonal is made up of five three wave moves, which does not fit this the rally from 118.73. The reason why I'm hesitating a bit calling the top is, that the EWO-indicator does not show us any significant divergence, which I would normally expect at the end of a rally of this degree.
EUR/NZD

My description of the rally higher yesterday has been a perfect match. With the slight break above the 1.5512 top confirms, that an important bottom is in place at 1.5080 and that a new major rally is developing. We have wave i of this new major rally in place and are now looking for wave ii. This wave ii should correct between 50% and 61.8% of wave i, which would mean a decline towards the 1.5263 - 1.5319 area before the next rally higher. However, we must remember that second waves are allowed to correct even more of wave i. Once this wave ii correction is over we should see and even more powerful rally high towards at least 1.6100, but I would not be surprised to see an even bigger rally towards 1.6578. But for now we should remain focused on the wave ii correction towards the 1.5263 - 1.5319 area.

Monday, April 15, 2013

Elliott wave analysis of EUR/JPY and EUR/NZD

 EUR/JPY

The wave iv of 5 correction I where expecting, has worked out nicely. We have already seen a small break below 127.70 with a low at 127.55 so the absolute minimum correction is fulfilled, but will we see more downside pressure? I don't expect much more downside pressure from here. Instead I expect a rally to set in soon for a move towards the 130.07 - 130.34 area in wave b of a possible triangle. Let it be said instantly, that I have no evidence, that a triangle might be building, but I do think it is a qualified guess, as I expect a complex correction in wave iv of 5 and a triangle will fit nicely into that expectation. It is also important to mention, that we should not see a break below the wave i of 5 high at 126.04 as that would leave us with an overlap between wave i and iv, which is not allowed under the Elliott Wave Principle when an impulsive rally is unfolding.

EUR/NZD

The rally from the 1.5080 low does have all the characteristics of an impulsive rally, but we still need a break above 1.5521 to confirm, that an important low is in place at 1.5080. If/when we break above resistance at 1.5521 I'm expecting that a new major rally is unfolding for a rally higher towards at least 1.6366 and likely even higher in the longer term. Short term I'm looking for a minor support at 1.5307 to protect the downside for the next rally higher towards 1.5490 from where we should some sideways consolidation before that last rally above important resistance at 1.5521. Once a new high, slightly above 1.5521 is set we should expect a correction towards the 1.5250 - 1.5305 area, from where an even more powerful rally is expected.

Sunday, April 14, 2013

Elliott wave analysis of gold

Gold

Please take a look at my long term Count for gold here first: http://theelliottwavesufer.blogspot.dk/2012/06/gold-is-shine-about-to-disappear.html

I know that on my long term I have the top at 1,920 as wave 5, but looking at the EWO indicator it only looks as it was wave 3 and the ongoing correction is wave 4 and wave 5 should follow once this correction is finished.

The first target I'm looking for after the break below strong support at 1,521 is at 1,250, but I would not be surprised to see it move even lower. However for now 1,250 does seem far away.

Thinking about it, a bigger correction after a rally of 655% does not seem that outrages does it?


Short term I expect a minor reaction back towards 1,520, but then more downside pressure should follow.

Friday, April 12, 2013

Elliott wave analysis of EUR/JPY and EUR/NZD

 EUR/JPY

With a high at exactly 130.90 my ideal target has been hit and we expects wave iv of 5 to develop. Wave iv of 5 is expected to be a relatively small and complex correction. Ideally it will be a triangle, but only time will tell. The ideal target for wave iv of 5 is at 127.89, but the area stretching from 127.70 - 128.40 is one big support-area. Short term I expect minor resistance at 130.81 will protect the upside for a break below 130.07 and more importantly a break below 129.75 that will confirm that wave iv of 5 is indeed unfolding. That said, as long as support at 129.75 has not been broken we must accept the possibility of further upside pressure, but we do think that the possible upside potential is very limited from here.

EUR/NZD

The break below 1.5173 invalidated my bullish count. I have changed our count slightly, marking the bottom at 1.5173 as wave iii of c and the top at 1.5521 as wave iv of c and the decline to 1.5080 was most likely wave v of c. As can be seen on the chart above the price quickly turned once 1.5080 was hit and performed a morning star candle, which is a sign of exhaustion. However we need more prof, that a bottom is indeed in place and a break above 1.5224 we be the first indication, that the test of 1.5080 was indeed the bottom, while a break above 1.5373 is needed to confirm the bottom and confirm the next powerful rally higher.

To be honest the new count for wave c is a much better fit, but some times one can't see the Wood for trees.... 

Thursday, April 11, 2013

Elliott wave analysis of EUR/JPY and EUR/NZD

 EUR/JPY

With a test of 130.53 my ideal wave iii of 5 target at 130.90 is within striking distance. As long as minor support at 129.37 keeps protecting the downside, we should ideally see a move closer to our target, but we are very close to a top and a break below 129.37 would be the first indication, that wave iii of 5 is over and wave iv of 5 taking over. The first target for wave iv of 5 will be at 127.89. As wave ii of 5 was a very deep and relatively simple structure, wave iv of 5 should be a complex and small correction, ideally it will be a triangle, but time will tell.

EUR/NZD

Wave ii has corrected exactly 100% of wave i, which is allowed under the Elliott Wave Principle, but is a rare occurrence. It should also be mentioned, that if wave ii had broken below wave i with just one tick my bullish count would have been invalidated. If wave ii have bottomed at 1.5173, then we should see a break above 1.5228 and more importantly a break above 1.5248 soon, which will be the first good indication, that a bottom might be in place. To confirm the bottom, however, we need a break above 1.5333, which would call for a rally back to 1.5521 in a perfect double bottom. That said we must be aware, that any break below 1.5173 will invalidate my current bullish count, but even if it occurred I still think that the potential downside pressure is very limited.

Wednesday, April 10, 2013

Elliott wave analysis of EUR/AUD

EUR/AUD

If my count is correct wave iii of 3 is just starting and a very powerful rally should soon unfold. Short term we could see red wave ii a bit deeper towards 1.2371, but from there or upon a break above 1.2536, we should see the next rally higher towards at least 1.2733 and more likely towards 1.2946 and maybe even higher.

Only a break below 1.2160 will invalidate my bullish count and call for a deeper correction before the next rally higher.

Elliott wave analysis of EUR/JPY and EUR/NZD

 EUR/JPY

We are clearly seen a loss of upside momentum, but as long as minor support at 129.35 and more importantly support at 128.44 protects the downside I'm still looking for one more new high closer to our ideal target near 130.90. Short term a break above 129.92 will confirm one last rally higher. That said, it should be accepted that we are close to the top of wave iii of 5 and a relatively large correction is to follow. It should not be a deep correction, to the contrary it should be a shallow and complex correction as wave iv of 5 unfolds. The ideal target for this wave iv will likely be at in the 127.77 - 128.03 area. 

EUR/NZD

My ideal corrective target at 1.5333 has been tested and surpassed by a fraction, but I think this correction is close to termination and the next powerful rally about to take off. A break above minor resistance at 1.5371 will be the first indication, that a bottom is in place, while a break above resistance at 1.5462 is needed to confirm that wave ii is over and wave iii higher is unfolding. That said, we must accept, as long as resistance 1.5371 protects the upside, that this wave ii correction could become slightly deeper towards 1.5310.